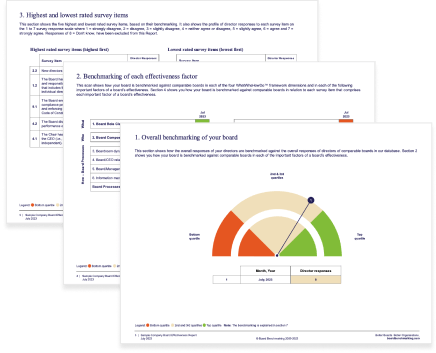
We have all seen lots of different reporting that is claimed to constitute benchmarking but often such reporting makes us wonder whether what we are seeing is the genuine article.
The genuine article would tell us at a glance whether the relevant measure is in the top quartile, the middle quartile of somewhere in the middle 50 percentile. Some reports purport to tell us whether the relevant measure is good, ok or bad compared to others but when you scratch a little deeper, the relevant reports are based on false logic.
Fake benchmarking
When it comes to surveys that are responded to on an agreement scale of 1 to 5, 1 to 7 or even 1 to 10, experience tells us that not all survey statements have the same average rating. Some survey statements are relatively easy to agree with and have a much higher average response whilst others are relatively hard to agree with and have a much lower average response.
For example, over 90% of directors agree or strongly agree that the board sets a high tone at the top in relation to the organisation’s culture, ethics and integrity. Only around 30% of directors, however, agree or strongly agree that the board actively oversees the growth of its organisation’s leadership talent pool. Using the same benchmark for these two survey statements would be ludicrous. It would also be misleading.
But many board effectiveness reports that purport to be benchmarked are not actually benchmarked as there is no comparison with the responses of other boards. This fake benchmarking uses a reporting scale that assumes all survey statements have the same average response.
Their reporting system assumes that an average response over a certain rating is good and an average response below a certain rating is bad but that is not the case. The rating scales for such surveys often look something like this:
Reports prepared using this fake benchmarking will almost always tell readers that the board is setting the right tone at the top but is not properly overseeing the growth of the organisation’s leadership talent pool. This simplistic reporting means that readers of the relevant reports will almost certainly misinterpret the relative strengths and weaknesses of the board.
Simplistic benchmarking
Companies that don’t have very sophisticated benchmarking systems and reporting often use the following simplistic way to benchmark survey responses. They combine the responses of the highest and second-highest rating and convert that to what is often referred to as a Percentage Favourable score – being the percentage of respondents who responded with one of the top two ratings. Knowing the average Percentage Favourable they advise readers as to whether the Percentage Favourable for a survey item is higher or lower than the average Percentage Favourable for that survey item and if so by how much.
Here’s an example:
Whilst this benchmarking is more useful than the fake benchmarking described above, it is somewhat inadequate because it:
- Does not take into account nor measure the full distribution of director responses. Only the responses of those who responded with one of the two top ratings are taken into account
- Does not tell the reader whether the director responses for that item are in the top quartile, bottom quartile or middle 50 percentile of comparable boards.
For this reason, even this simplistic benchmarking can lead to readers misinterpreting the relative strengths and areas for improvement of a board.
Comprehensive, authentic benchmarking
Board Benchmarking has been using comprehensive, authentic benchmarking for over 15 years. Our reports tell boards whether they are benchmarked in the top quartile, bottom quartile or middle 50 percentile of comparable boards in relation to:
- the overall effectiveness of the board
- each of the 20 most important factors that contribute to a board’s performance and effectiveness
- each of the survey items that comprise each factor.
To request a sample of Board Benchmarking’s comprehensive reporting, please get in touch.
To better understand the benefits of benchmarking click here.


